Our visualisation engine will help you change raw live data (like logs or incoming requests) into visualized charts, animations, trees and more!
Features:
- Javascript API with script editor.
- Real-time data flow, statistics and aggregation engine.
- ELK integration.
- Unique visualization model that allows to connect multiple visualization methods in one data flow.
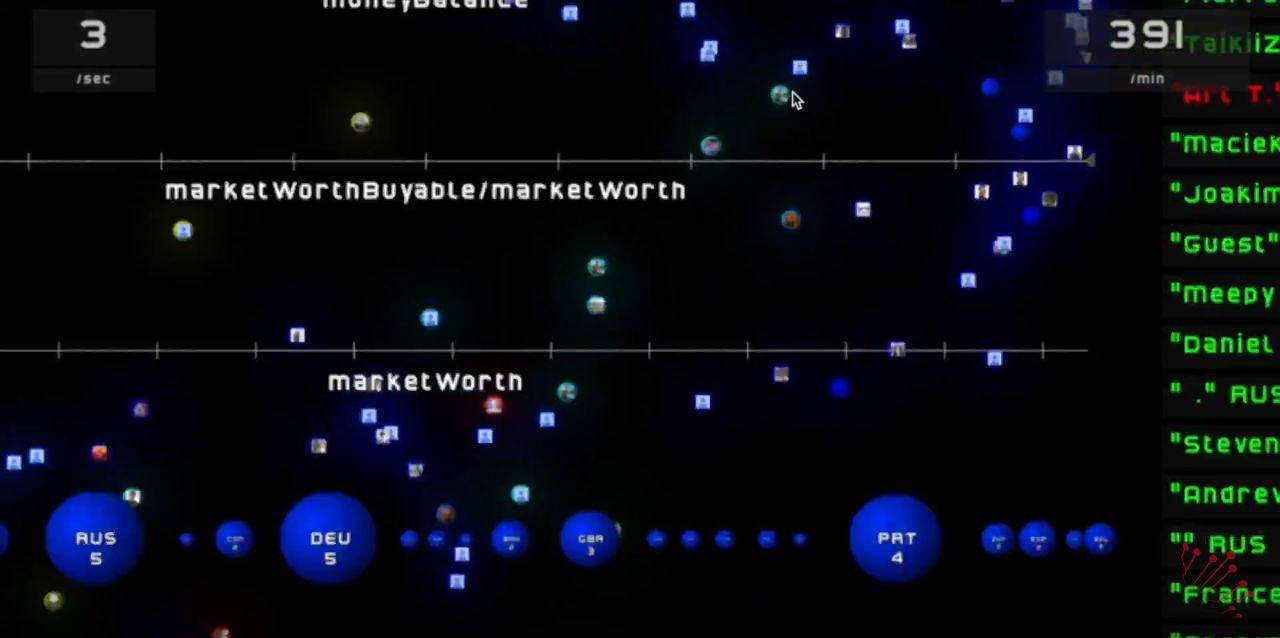
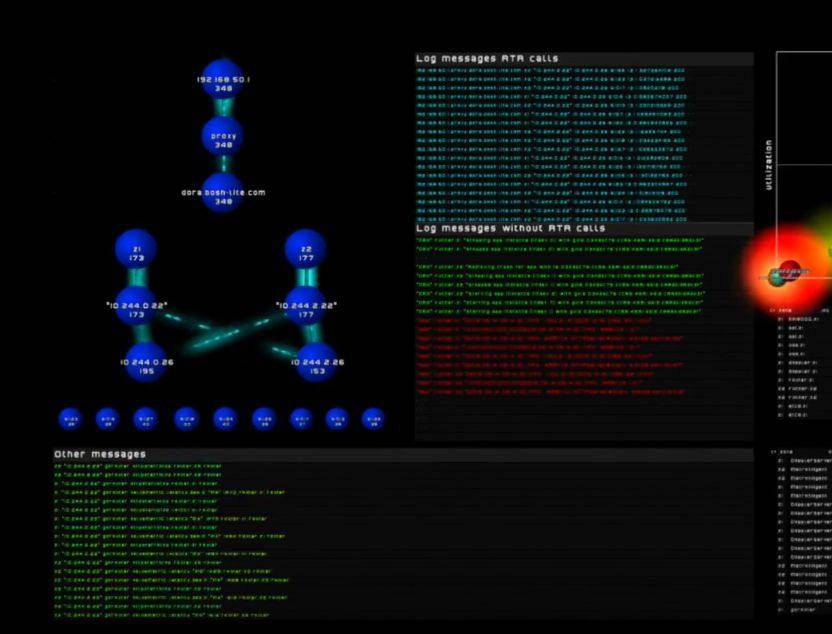
- Visualization algorithms
- Sankey for layered flow
- Tree(Gource)
- Motion Chart
- Map for geographic data
- Counter
- Table